Merrill Lessley and Paul Beale
"Laser Light Math1: Music to the Eye"
Laser images were first captured in high-resolution video and then moved to
single frame digital photos. MOV clips available (dynamic and beautiful),
8.5" X 11", 2006-2007.
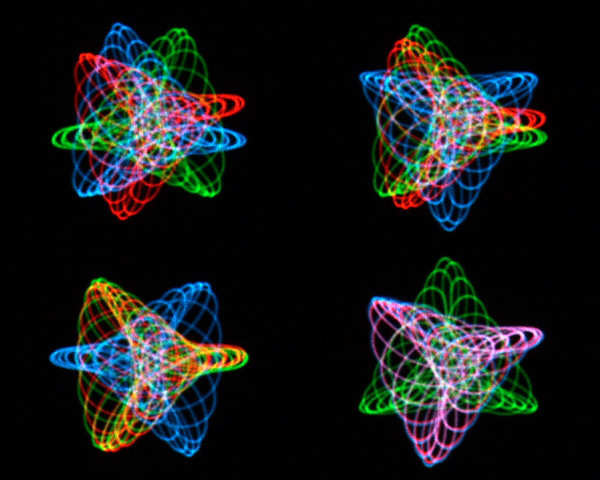
"Laser Light Math1" was constructed by scanning three lasers with sine/cosine signals.
The base image requires a mathematical approach similar to those used to graph traditional curves
(like hypotrochoid or epitrochoid). However, unlike graphed representations, this image requires
rapidly moving laser dots. Thus, common equations are modified to accommodate the "dynamic" nature of the process.
While the traditional formula for a hypotrochoid curve starts with x=(a-b)cosT,
here we use x=(a-b)*cos(omegaO*T). OmegaO=2*pi*(base frequency).
Frequency is how often (per second) the laser completes a single sine/cosine scan.
"T" is whatever wave synthesis step (1 to 512) the sine or cosine function is at.
"Laser Light Math2: Music to the Eye"
Laser images were first captured in high-resolution video and then moved to
single frame digital photos. MOV clips available (dynamic and beautiful),
8.5" X 11", 2006-2007.
"Lessley2" was constructed by scanning three lasers with sine/cosine signals.
Constructing the base image requires a mathematical approach similar to graphing
(Cartesian) the hypotrochoid curve. However, unlike simple graphed representations,
this image requires the use of rapidly moving laser dots. Thus, the common equation
is modified to accommodate the "dynamic" nature of the scanning process. While
the traditional formula for a hypotrochoid curve starts with x=(a-b)cosT, here
we use x=(a-b)*cos(omegaO*T). OmegaO=2*pi*(base frequency). Frequency is how
often (per second) the laser completes a sine/cosine scan. "T" is whatever wave
synthesis step (1 to 512) the sine or cosine function is at.
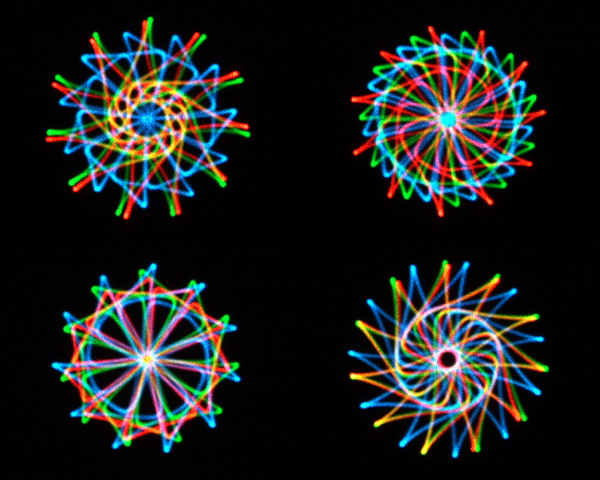
"Laser Light Math3: Music to the Eye"
Laser images were first captured in high-resolution video and then moved to
single frame digital photos. MOV clips available (dynamic and beautiful),
14" X 14", 2006-2007.

"Laser Light Math3" was constructed by scanning three lasers with sine/cosine
signals. The base image requires a mathematical approach similar to graphing
a special case (rose) of the hypotrochoid curve. The Cartesian equation is modified
to accommodate the "dynamic" nature of the scanning. While the traditional formula
for a hypotrochoid curve starts with x=(a-b)cosT, here we use x=(a-b)*cos(omegaO*T).
OmegaO=2*pi*(base frequency). Frequency is how often (per second) the laser
completes a sine/cosine scan. "T" is whatever wave synthesis step (1 to 512)
the sine or cosine function is at. Additionally, a=(2n)*h/(n+1) and b= (n-1)/(n+1*h.
("h" controls image size). "n" is the number of petals.
Merrill Lessley and Paul Beale
Merrill Lessley is a professor in the Department of Theatre and Paul Beale is
a Professor in the Department of Physics
at the University of Colorado at Boulder
Merrill Lesslet lives in Longmont, Colorado, USA and Paul Beale lives in Boulder,
Colorado, USA
"These "sequences" of laser images are the product of interdisciplinary
research regarding the design and construction of a computer-controlled laser
projection system. The system precisely shapes or graphs a variety of mathematical
curves (epicycloids, hypocycloids, roses, epitrochoids, hypotrochoids, and other
special sine/cosine cases). By graphing such curves, a wide variety of appealing
images can be created. Unlike drawing them with a pencil on paper, however,
projecting such curves with a laser poses a particularly challenging problem.
While a laser is often referred to as a kind of "pencil" in light,
it can only be used to generate a complete picture by moving its projected "dot"
rapidly and repeatedly over a reflective surface. The images shown here were
scanned at about three hundred times per second. Interestingly, when that pattern
represents one of many intriguing mathematical curves, beautiful images in moving
light appear that are simply ... 'Music to the Eye.'."